Signal Builder
What is the Signal Builder?
The Signal Builder is a powerful tool that allows you to create and design your own trading strategy. You’ll be able to choose from 9 of the most famous technical indicators and combine them as you wish to fit your needs, creating amazing trading signals, regardless your level of expertise.
Once you’ve come up with your ideal trading strategy, you will be able to back-test it with historical data on real market graphics, and see for yourself if your designed strategy provides good buy/sell signals and results. You can test as much as you want without putting in risk any of your capital. Once you feel confident, you can connect MetaTrader with your Binary Options broker and start trading for real.
How to load it on Metatrader?
MT2Trading platforms counts with a built-in installer for both MetaTrader 4/5 platforms and all the available connectors & plugins. Signal builder can be found among these, so installing and loading in MT4/MT5 is very simple:
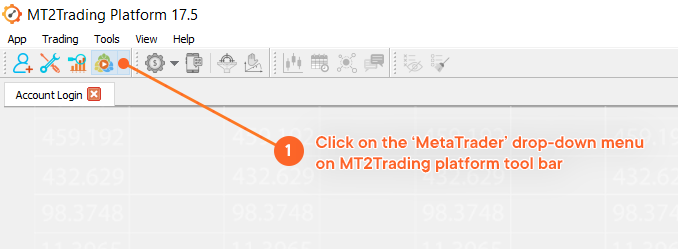
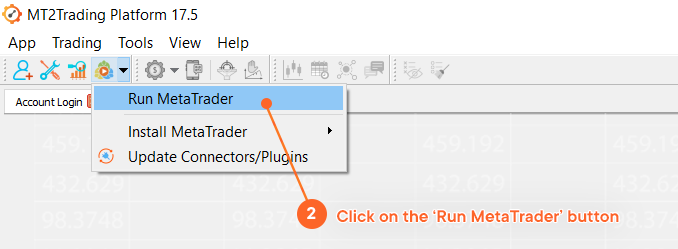
1. Click on the ‘MetaTrader’ drop-down menu on MT2Trading platform tool bar
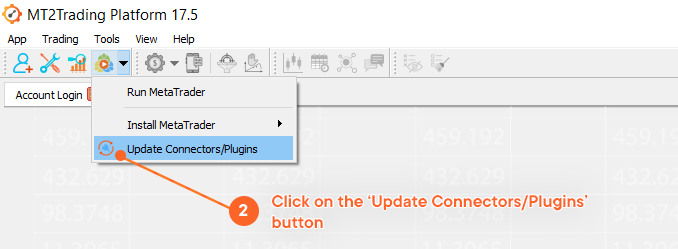
2. Click on the ‘Update Connectors/Plugins’ button and a window will pop-up
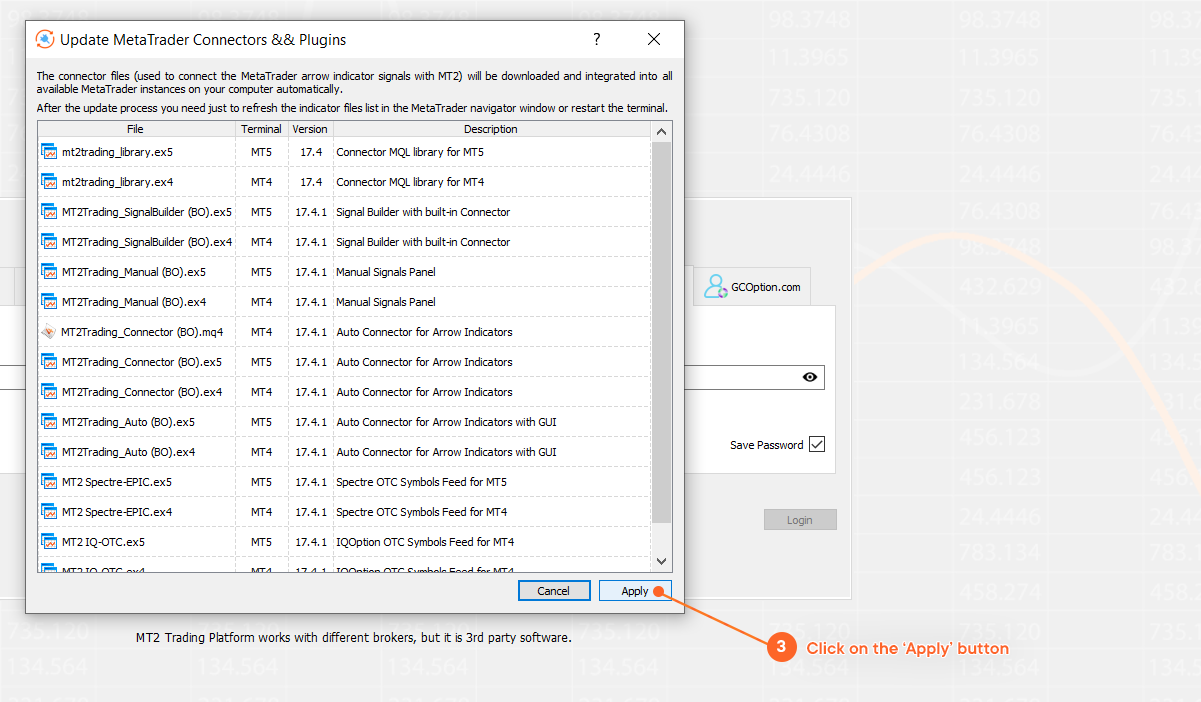
3. On the window you will see all the available plugin/connectors. By clicking on ‘Apply’ all of them will be downloaded on your pc and integrated to all the available MetaTrader instances on your PC.
How to open it on MetaTrader?
First of all you need to open a MetaTrader 4/5 instance on your computer. In order to do so, repeat the previous steps but instead of clicking on ‘Update Connectors/Plugins’ you should now click on ‘Run MetaTrader’.
1. Click on the ‘MetaTrader’ drop-down menu on MT2Trading platform tool bar
2. Click on the ‘Run MetaTrader’ button and a window will pop-up
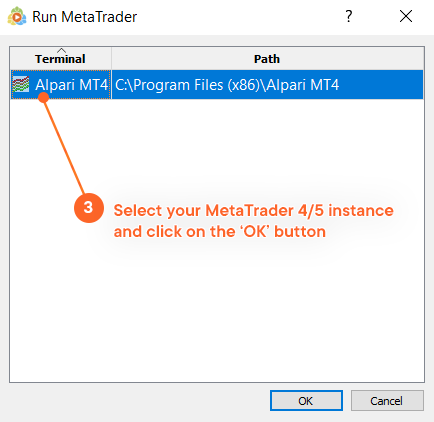
3. Select your MetaTrader 4/5 instance and click on the ‘OK’ button. The MetaTrader platform you selected should now open.
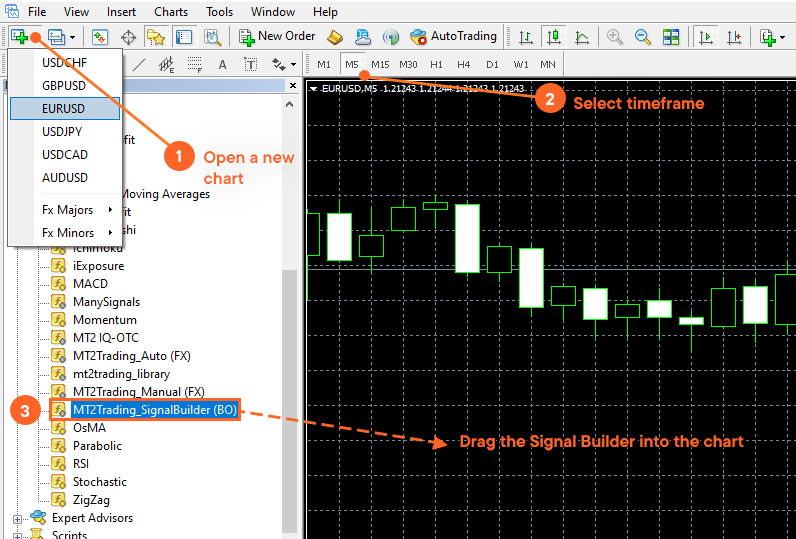
Once you have the Signal Builder files inside your MetaTrader folders, proceed to open it on a chart. To open it, follow these steps:
- Open a new chart and choose the desired timeframe.
- Open MetaTrader’s Navigator: Press CTRL + N.
- Drag the Signal Builder to our chart.
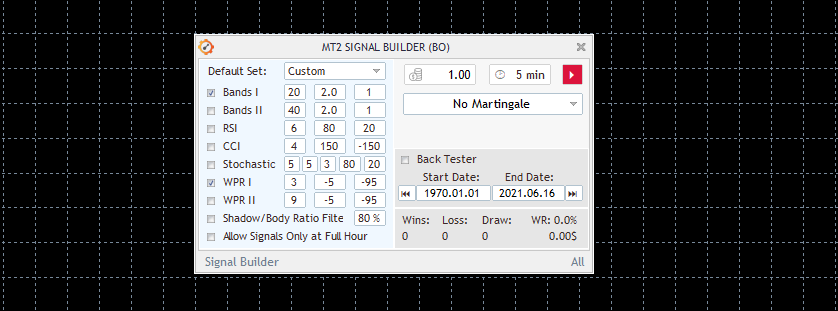
Inputs section

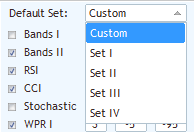
1. Default sets
Default sets are pre-built combinations of different technical indicators and their respective parameters. You can either choose any of the four default sets or create a custom one, according to your specific needs.
Each one of these sets compose unique trading strategies, which will produce totally different signals and results on different market conditions. Back-testing is recommended in case you choose any of the default sets, in order to have an idea of the results they could produce in combination with your trading amounts & timeframe, Martingale strategy and risk management parameters, among others.
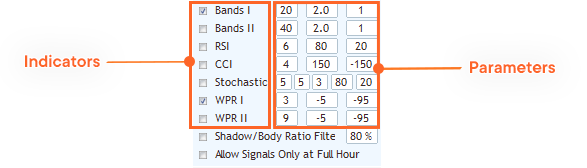
2. Technical indicators
The Signal Builder will allow you to create your own signals based on different famous technical indicators. In order to design a custom strategy, you will need to enable/disable these indicators and assign specific parameters to each one of them.
A. Bollinger Bands (Bands l & Bands ll)
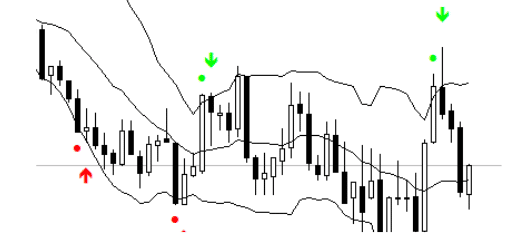
Bollinger bands are one of the most used indicators to compare the volatility of the price of any asset and the relative value of its price over a period of time. Bollinger bands are used to:
- Identify periods of high or low volatility.
- Identify changes in trend in the price.
- Identify strength or weakness in the price trend.
The standard deviation is a statistical parameter that provides a good indication of volatility. The use of this parameter to calculate the bands ensures that these will respond quickly to price variations reflecting periods of high and low volatility. Likewise, the strip between the upper and lower bands contains, statistically, almost 90% of the possible price variations, which means that any movement of the price outside the bands has special relevance.
The Bollinger bands are composed of three values.
- The upper band represents the simple moving average plus X times the standard deviation.
- The middle band displays a simple moving average.
- The lower band corresponds to the simple moving average minus X times the standard deviation.
You can configure the moving average periods, and the deviation of our bands with respect to the moving average, as well as the displacement, the latter will move the bands, to the left will be a value negative, and on the right a positive value.
You will have the possibility to configure up to two Bollinger bands.
Parameters:
1. Period: Number of candles that will be taken into account to make the calculation.
2. Deviation
3. Shift
B. RSI (Relative Strength Index)
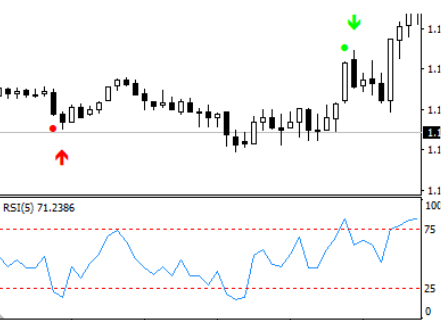
Relative Strength Indicator performs a series of calculations on the closings of the last X sessions (14 sessions the most usual parameter) and shows the force of the movement. Basically the higher the closures the higher the value of the RSI, and the lower the closures the lower the value of the RSI. The RSI scale goes from zero (0) to one hundred (100). This calculation is carried out by the computer, and we only see values translated to a line (in this case, blue).
When this value reaches an upper limit ( in this case 75 ) it is considered an overbought market and it is said that there is a “high” probability that the price will go down. Applies the same case for the lower value (in this case 25), which is called oversold market with the difference that now, the price tends to go up. Following the previous methodology, our indicator will send a buy signal when the price is below the lower level , and will send a sell signal when it surpasses the superior level .
You can establish the periods of your RSI, as well as the overbought and oversold levels.
Parameters:
1. Period: Number of bars that will be taken into account to measure the hardness of the price until the last bar formed.
2. Overbought Level: It is suggested that this level be above the value of 70.
3. Oversold Level: It is suggested that this level be below the 30 value.
C. CCI (Commodity Channel Index)
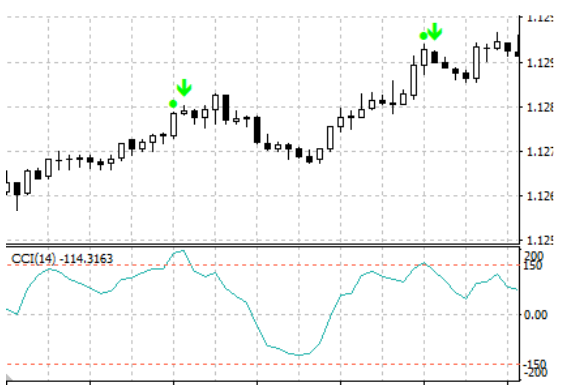
A versatile indicator that can be used to identify a new trend in the market or warn about extreme conditions.
In general terms, CCI measures the current level of the price in relation to an average price level during a given period of time. The CCI is high when the prices in the market are well above its average and is relatively low when prices are well below average. In this way, the CCI can be used to identify overbought conditions (the financial asset has been excessively bought) and oversold (the financial asset has been excessively sold). You can establish our CCI periods, as well as the overbought and oversold levels, and the price that will take into account.
Parameters:
1. Period: Number of bars that will be taken into account to measure the hardness of the price until the last bar formed.
2. Overbought Level: It is suggested that this level be above the 100 value.
3. Oversold Level: It is suggested that this level be below the value of 100.
D. Stochastic Oscillator
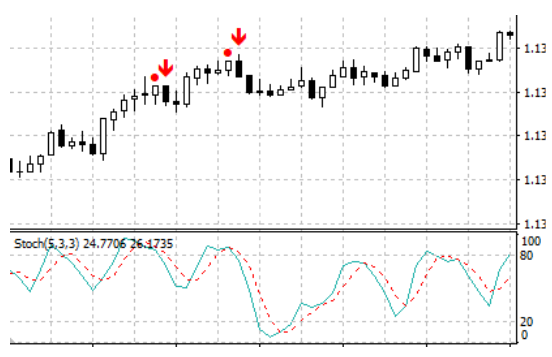
This technical indicator compares the current closing price with the price range for a certain period of time. The indicator consists of two lines. The main line K (blue color). The second line D (dotted red) is the moving average of the K line.
The indicator (SignalBuilder) will send a sell signal when the red line is above/below the levels we established as overbought and oversold. In this case, it sends a sell signal because our stochastic exceeds the overbought level, and the candle closes above it. You can configure the values of our stochastic directly in the SignalBuilder.
Parameters:
1. K Period: Number of time periods used in the stochastic calculation.
2. D Period: Number of time periods used when calculating a moving average of K.
3. Slowing: This value controls the internal smoothing of K. A value of 1 is considered a fast stochastic; a value of 3 is considered a slow stochastic.
4. Overbought Level: We suggest this level to be above 70.
5. Oversold Level: We suggest this level to be below 30.
E. WPR l & ll (Williams Percent Range)
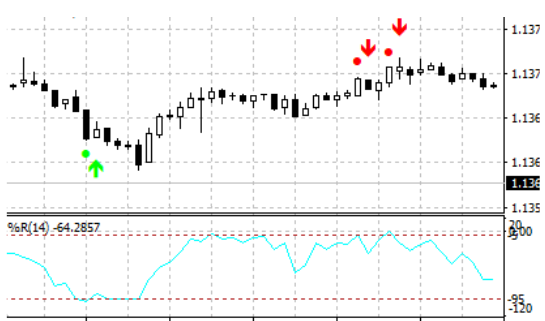
Williams Percent Range (WPR) is a dynamic indicator that determines the overbought/oversold status. The WPR is similar to the Stochastic Oscillator. The difference between them consists only in that the WPR has the scale inverted and the Stochastic is constructed using the internal smoothing. The indicator takes into account a period for the mathematical calculation. It has the very particular characteristic to work on negative percentage values. It is important to have this in mind since the parameters that you will have to set must be between the values 0% and -100%. Otherwise, the values will never reach a positive value, verify that the levels are negative.
Indicator values within the range of -80% to -100% indicate that the market is oversold. Indicator values within the range of -0% to -20% mean that the market is overbought. The Williams Percent Range indicator anticipates price turns. Almost always forms a spike and turns down a certain period of time before the price reaches its peak and turn down. In the same way, the Williams Percent Range usually forms a valley and is turned upwards in advance. Inside our Signal Builder, we can configure the periods and the overbought/oversold levels.
Parameters:
1. Period: Number of candles used in the calculation.
2. Overbought Level
3. Oversold Level
3. Trading parameters
These two parameters will determine the initial amount for each one of your trades, as well as the desired expiry time.
![]()
A. Trade Amount
Parameter destined to specify the trade amount.
In the example, the trade amount is “1.0” which means that each the robot will open trades of $1 USD.
To change the trade amount, just modify this parameter.
For example: For $5 USD, you should write “5.0”. For $10, “10.0”, and so on …
B. Expiry Time
Use this parameter to specify the expiry time of your trades.
In the example, the expiry time is set to “5”. This means that each operation that the robot executes, will automatically close 5 minutes after being placed. If you would like major or minor temporalities, modify this number.
4. Martingale strategy
The idea of the Martingale strategy is to counteract the losses caused by lost trades. In standard Martingale, if you lose a trade, you re-enter with a greater trade amount, so that over time, a winning trade will compensate all the previous losses. This new trade amount is equivalent to the amount of the lost trade multiplied by a Martingale coefficient. It should be noted that Martingale strategy can be risky, so you will have to be very careful when setting it up.
By default the Martingale strategy is disabled.
To activate it click on the menu where it says “No Martingale” to choose your preferred option, and define Martigale steps and coefficient.
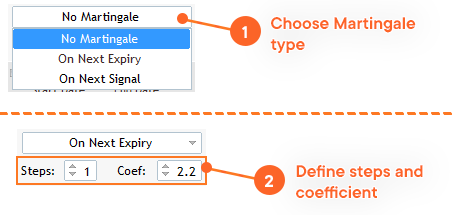
A. Martingale type
- “On the next expiration” (On next expiry): The martingale will be applied immediately after the close of the current trade.
- “On the next signal” (On next signal): The martingale will be applied on the next signal of the same currency pair.
B. Martingale Steps:
This parameter defines the length of the Martingale series.
By default, there are 2 steps. If you lose an operation, the first step of Martingale will be applied where you multiply the amount of your entry by the chosen coefficient. In case the first step of Martingale is also lost, the second and last step will be applied. If you lose the last step of Martingale, the step count is reset.
You can use as many steps as you wish to adjust your strategy, but remember that the greater number of steps, the greater the risk.
C. Martingale coefficient:
This parameter defines the multiplier of amount per trade in each step of Martingale.
For each lost trade, a new amount must be calculated to be applied in the next operation. Therefore, the amount of the last trade will be multiplied by the martingale coefficient.
In the example above, if the operation with an amount of $ 2 USD results in loss and we have a Martingale coefficient of 2, we will multiply $ 2 USD x 2 and the next step of Martingale will be $ 4 USD.
$ 2 USD x 2 = $ 4 USD.
5. Backtester configuration
Once you’ve finished designing your signal, you can back-test it on MetaTrader market charts. This functionality is very useful as it is based on historical data and statistics collected from past market charts, allowing you to analyze what the results of your signals would be.
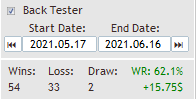
A. Back Tester
Enable/Disable box in order to activate or de-activate the Back Tester functionality.
B. Start Date
Before to adjusting the start date, you must download the MetaTrader market charts historical information.
To download the history:
- Click on “Tools > History Center”.
- Select the currency pair over which you want to download the data.
- Click on the “Download” button (it is suggested that you do this step, regardless of whether the icon next to the temporality is colored or not).


C. End Date
Deadline where the Back Tester will stop gathering information of the signals.
D. Win, Loss, Draw, WR (Win rate) and balance change
After running the back tester, information regarding your signals performance will be available:
- Wins: Amount of won trades
- Loss: Amount of lost trades
- Draw: Amount of draw trades
- WR (win rate: Percentage of won trades over total trades
- Balance change: Total amount of account balance increase or decrease